19 Jan 2026
There is a lot of hype around AI right now, and I was a skeptic for a long time as many close friends know. In the past it required precise prompts that were long-winded, and even then you didn’t always get the result you wanted. During my early attempts I found that I could often just do the task manually faster than I could with AI. But I have been periodically trying new techniques and watching what others do. Recently, I’ve started to see the value in certain tasks.
The goal of this post is to give you several practical, minimal-setup ways to get value from AI today. These examples use VS Code with Copilot, but many of the same concepts work for other coding agents. Since I’ve started using these techniques, I’ve become more optimistic about AI productivity. There are still unanswered questions (cost, ethics, repeatability, trust of output), but I can’t deny some of the benefits are real.
Running through tutorials
New projects often require stepping through complex commands with specific environment variables and configurations. When things go wrong, debugging with unfamiliar tools slows everything down.
This prompt helps me step through a project’s getting started guide and handle unexpected debugging steps:
You are going to help me walk through this readme and get the project setup. Do not run any commands without asking. If you need environment variables ask. If we find any issues let's fix them so the readme ends up in better shape at the end. If there is a secret involved, don't ask me for it but tell me how to set it up myself.
IMPORTANT: These days I mostly work with projects where secrets are no longer handled thanks to technology like federated identities and Azure Managed Identities but not all projects are that way. Do NOT enter secrets if the AI agent asks you to, only fill in non-secret environment variables and manually set up secret environment variables.
While this might seem simple (why not just copy paste?), what is interesting about using this technique is that I learned I prefer asking the agent to generate complex command lines, which enables me to be more creative since I don’t need to memorize some esoteric command structure. I no longer care if -v means verbose or version (this seriously drives me crazy, why can’t we all just agree ;-) ) and it frees me up to do more interesting things.
Generate bug reports
Filing bug reports is tedious when creating minimal reproductions and filling out templates takes time to do it well. AI is really good at creating scripts that can reproduce issues. The prompt I’ve been using goes something like:
I found a bug in agent framework (https://github.com/microsoft/agent-framework/). Can you help me file a report? I would like to generate a minimal reproduction and a way to test it. Find and fill out the bug report in a concise manner using the GitHub issue template (usually located in https://github.com/org/project/tree/main/.github/ISSUE_TEMPLATE) from the project exactly. Present the markdown for the issue to me locally. The bug is: Durable agents using AzureOpenAIResponsesClient with tools fail on the second turn of a conversation. The call_id_to_id mapping is not restored from durable state.
An example of a bug report filled out this way is https://github.com/microsoft/agent-framework/issues/3187. This took significantly less time than if I had needed to design a minimal reproduction myself.
Fixing CI on my projects
We use Dependabot to bump dependencies in our projects. Sometimes Dependabot fails and I have to go figure out what is going on. It’s usually a syntax issue or breaking change that needs to be addressed. I’ve been using ~GitHub MCP server~ gh cli as a tool to do this quickly via an agent. (I recently learned that we should avoid MCP in this scenario to avoid context bloat)
Go look at the GitHub CI for this pull request https://github.com/hyperlight-dev/hyperlight/pull/1156 using the gh cli. Find out what is wrong and then come up with a plan to fix it and present several options to me. Make sure to identify why the job is failing, considering several options. Don't make any code changes until after I approve the plan to fix this issue.
An example of using this technique to fix a failing CI in action is https://github.com/hyperlight-dev/hyperlight/pull/1153
Using Slash Commands
So far I’ve been giving you the prompts and you would need to modify them for each session. The next tip is to use slash commands to make these reusable. Here is one I use for submitting commits in a PR. These prompt files can be stored local to the project at .github/prompts or if you want to use them for all projects in VS Code, you can put it in your VS Code profile something like (%APPDATA%\Code\User\profiles\prompts or $HOME/.config/Code/User/profiles).
Invoke the slash command via: /whycommitmessage. Note that cm is my personal alias for commit (you might need to tweak it).
---
name: whyCommitMessage
description: Generate a why-focused git commit message in multi-line format.
argument-hint: The changes or context to generate a commit message for
---
Generate a git commit message for the current changes or discussion.

Requirements:
- make sure we are not on the main branch, create a branch if so
- Focus on **why** the change was made, not just what changed
- Explain the problem being solved or the motivation behind the change
- Use the format: `git cm "short summary" -m "detailed explanation"`
- The short summary should be concise and action-oriented (imperative mood)
- The detailed explanation should provide context about the reasoning, benefits, or problems addressed
- Do not include the changes or a list of changes

Step 1: output the "short summary" and "detailed explanation" and ALWAYS ask user to confirm it
step 2: execute the `git cm "short summary" -m "detailed explanation"`
step 3: Ask the user if they want to open a pr and if so push the code with "git push". Verify we are on a branch not main.
And as an additional example, We can turn the bug report prompt into a reusable slash prompt. As you can see it can be more detailed and provide more context to the agent.
Invoked with the slash command: /bugreport https://github.com/microsoft/agent-framework/ Durable agents using AzureOpenAIResponsesClient with tools fail on the second turn of a conversation. The call_id_to_id mapping is not restored from durable state
---
name: bugreport
description: File a bug report using a project's GitHub issue template with minimal reproduction
argument-hint: repo-url followed by bug description
---

Help me file a bug report for a GitHub project.

## Input Format
The user will provide:
1. **Repository URL**: The GitHub repository URL (e.g., `https://github.com/org/project`) otherwise use the project they are current in.
2. **Bug Description**: A description of the bug they encountered, otherwise use the context from the current conversation

## Workflow

### Step 1: Fetch the Issue Template
- Look for bug report templates in the repository at `.github/ISSUE_TEMPLATE/`
- Common template names: `issue.md`, `issue.lang.md`, etc
- If no template exists, use a standard bug report format

### Step 2: Analyze the Bug
- Understand the bug description provided
- Identify the component/feature affected
- Determine expected vs actual behavior

### Step 3: Generate Minimal Reproduction
- Create a minimal code example that reproduces the issue
- Include only the essential code needed to trigger the bug
- Add comments explaining each step
- Create a folder ./bugs/<bugname> to store the reproducible file

### Step 4: Create Test Case
- Generate a test that demonstrates the bug
- The test should FAIL with the current behavior
- The test should PASS once the bug is fixed

### Step 5: Fill Out the Issue Template
- Use the EXACT template structure from the project
- Be concise but complete
- Include:
  - Clear title
  - Environment details (versions, OS, etc.)
  - Steps to reproduce
  - Expected behavior
  - Actual behavior
  - Minimal reproduction code
  - Test case (if appropriate)

### Step 6: Present the Issue
- Output the complete markdown for the GitHub issue in ./bugs/<bugname>/report.md
- Format it ready to copy/paste into GitHub

## Output Format
Present the final bug report as a markdown code block that can be directly pasted into GitHub Issues.
Running Multiple Code Reviews
Code reviews require checking out branches and carefully examining changes. I now use agents to catch syntax issues and edge cases I might miss. VS Code and Copilot are unique since they can spawn sub-agents for different models. The real power comes from running multiple models in parallel—each catches different things. This is powerful since each model analyzes independently with a different set of abilities, and the results are summarized. Issues reported by multiple models are more likely to be real problems.
Invoked with the slash command: /codereview
---
name: codereview
agent: agent
---
look at the commits for this branch and run a code review on them in parallel agents using opus, gpt 2 codex and gemini then give the critical feedback and analysis of which bugs were reported across the agents. Only look at issues that are introduced in the changes for this branch. Include line numbers when reporting out.
Skills
While they are fairly new, I’ve been starting to explore what skills can do for me. One I’ve created is for generating our Release PRs. Creating skills can be done by hand, but why not create one with a skill itself?
Luckily Anthropic has a skill we can leverage. Ask the agent to download and store this skill:
can you download the skill at https://github.com/anthropics/skills/tree/main/skills/skill-creator and put it in my skill folder
This should end up in .github/skills/ folder for your project but it could also go in ~/.copilot/skills/ or ~/.claude/skills/.
Next you can ask Copilot to use the newly downloaded skill to create a new skill. I did something like this:
Using skill-creator, add a release-prep skill to implement #file:how-to-make-releases.md. The goal is to have a PR that looks like https://github.com/hyperlight-dev/hyperlight/pull/668 that incorporates the version updates and the output to the Changelog. You can skip steps required by the maintainer like creating tags and invoking the release CI steps.
A few last tips
I am not going to go into detail on these but if you found this useful you might want to try these out on your own:
- Using plan mode - This added step changed the output on more complicated tasks that I’ve asked the agent to accomplish. While not a silver bullet, it improved the quality significantly.
- Custom Agents - These have been useful in certain scenarios but not as helpful as I’ve hoped. I am still trying to figure out the right use cases. The community maintains a set of these: https://github.com/github/awesome-copilot/tree/main/agents
- Asking for ASCII art or Mermaid diagrams - Agents do surprisingly well at generating Mermaid diagrams, and I’ve found that for memory-related visualization, ASCII art can go a long way toward understanding. Just double check the output—sometimes it’s not 100% right, but it often gets me started on what it might look like.
Hopefully this shares some practical tips for you to try out. If you have other tips or one of these helps out, please let me know.
25 Mar 2023
Containerd provides a mechanism that allows runtime authors to integrate with containerd via the shim api. The general way this works is that containerd invokes a binary on the host then communicates via an IPC channel that works for a the operating system (namedpipes on windows). There is a lot of details in the readme but that is the gist.
It can be tricky to debugging the runtime is that since it is a new process that splits off from the main containerd process. There is a lot of setup that happens when the shim initially launches like creating the rootfs or configuring and launching the container process. It is hard to attach a debugger at that critical time. Once the process is running especially, if it long running, you can attach a debugger just fine but there is a lot of details that happen in the first few moments of the shim starting up.
I came across a great way of handling this and I just have to share it. This is in the Windows Containerd Shim but could be used for an Windows process that is similar.
Important note: This is for developer debugging do not do this in production. It will stop all shims in there tracks.
For the Windows shim you can set an env variable, then start containerd:
$env:CONTAINERD_SHIM_RUNHCS_V1_WAIT_DEBUGGER = "true"
.\containerd.exe -c .\config.toml -l trace
time="2023-03-25T14:32:41.237855400-07:00" level=info msg="starting containerd" revision=63e45eb5d8b3949195b5332876b591d88977f3b9.m version=v1.7.0-34-g63e45eb5d.m
...more startup output...
time="2023-03-25T14:35:25.845627800-07:00" level=info msg="Start event monitor"
time="2023-03-25T14:35:25.845740900-07:00" level=info msg="Start snapshots syncer"
time="2023-03-25T14:35:25.845740900-07:00" level=info msg="Start cni network conf syncer for default"
time="2023-03-25T14:35:25.845740900-07:00" level=info msg="Start streaming server
Once containerd is running you can start any container. I will show it with ctr.exe but it can be started from any interface like nerdctl or crictl.
ctr run --rm gcr.io/k8s-staging-e2e-test-images/busybox:1.29-2-windows-amd64-ltsc2022 win sleep 100
You will immediately see the process hang, and it is not because of the sleep. If you go and look at the containerd logs you should see:
time="2023-03-25T14:38:43.235031500-07:00" level=info msg="Halting until signalled" event="Global\\debugger-17216"
The shim was launched and it is waiting until you tell it to continue! The last few numbers are the process id:
ps *shim*
Handles  NPM(K)    PM(K)      WS(K)     CPU(s)     Id  SI ProcessName
-------  ------    -----      -----     ------     --  -- -----------
    107       9    18956      13108       0.02  17216   1 containerd-shim-runhcs-v1
So now, before all the important things happen, you can attached a debugger. You can attach it via console or do it remotely and then use something like goland or vscode to attached to the remote debugger.
dlv --listen=:2345 --headless=true --api-version=2 attach 17216
Now you will notice that even though the debugger might be attached, the process hasn’t continued. This is because it is waiting for an explicit event to continue. To do this you can use a tool docker-signal which is a small program that sends the expected event. Clone the repo and run the tool.
Don’t forget to set a breakpoint in the debugger first!
go run .\docker-signal.go --debugger -pid 34344
And there you have it! Attaching the debugger before all the critical code runs can save tons of time figuring out that critical bug.
The containerd shim does need to be built with debugging info. To do that clone the code, build it and copy it to the containerd path:
cd .\projects\hcsshim\
go build -gcflags "all=-N -l" .\cmd\containerd-shim-runhcs-v1\
cp containerd-shim-runhcs-v1.exe ../path/to/containerd/folder
Looking under the covers
This is great, but how does it work? The important part is during the CreateTask:
func (s *service) createInternal(ctx context.Context, req *task.CreateTaskRequest) (*task.CreateTaskResponse, error) {
	setupDebuggerEvent()
    ...
}
The Create task is one of the first calls that containerd makes and is before all the critical code that creates the layers and containers in Windows. Let’s take a look at setup DebuggerEvent:
func setupDebuggerEvent() {
	if os.Getenv("CONTAINERD_SHIM_RUNHCS_V1_WAIT_DEBUGGER") == "" {
		return
	}
	event := "Global\\debugger-" + fmt.Sprint(os.Getpid())
	handle, err := createEvent(event)
	if err != nil {
		return
	}
	logrus.WithField("event", event).Info("Halting until signalled")
	_, _ = windows.WaitForSingleObject(handle, windows.INFINITE)
}
If that env variable isn’t set then skip this part, otherwise create a Windows Event and wait for the event. WaitForSingleObject in Windows will put the current threat to sleep until the event is signaled.
And you guessed it, signaling the event is what docker-signal does!
	ev := fmt.Sprintf("Global\\%s-%s", key, fmt.Sprint(pid))
	h2, _ := OpenEvent(EVENT_MODIFY_STATUS, false, ev)
	if h2 == 0 {
		fmt.Printf("Could not open event. Check PID %d is correct and is running.\n", pid)
		return
	}
	PulseEvent(h2)
Conclusion
This is a nifty little trick to use when you have complex processes that interact across boundaries. Even though this example is for Windows Container shim, it could be done in an process where it is difficult to start up the debugger and it could be in any language!
Bonus content
This type of trick can be used for all sorts of stuff. Another example is containerd where we use the signal to dump the stacks at any time the event is received. Get creative and have fun!
https://github.com/containerd/containerd/blob/f7f2be732159a411eae46b78bfdb479b133a823b/cmd/containerd/command/main_windows.go#LL70
04 Mar 2023
When setting up the Debugger for Rust in VS Code you have two options depending on which operating system you are running on. The rust analyzer extension doesn’t support debugging out of the box you must install one of the following:
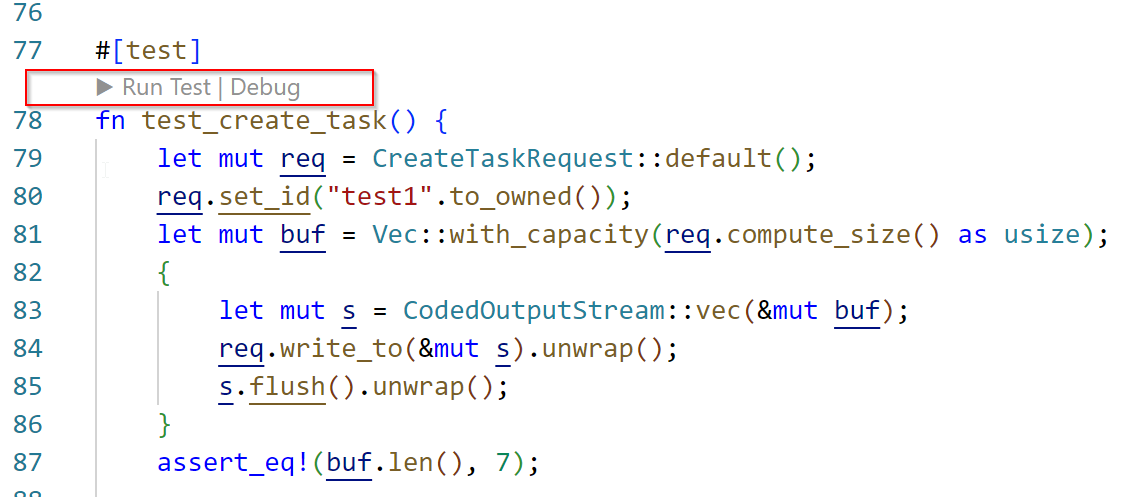
Once you have those installed, running tests and console applications are easy to get started with the debugger through the added meta data:
More advanced setup
Those work great for simply scenarios but what happens if you want to run your application with command line parameters or set environment variables? You will need to create a launch.json debugger configuration. The config needed will differ depending on if you are using the C/C++ for Windows or the CodeLLDB for linux.
CodeLLDB on Linux
Let’s look at the CodeLLDB configuration for Linux first as it is a a little simpler. The project this configuration works for is https://github.com/containerd/rust-extensions but should give you the idea of how to configure it for other projects.
{
    "version": "0.2.0",
    "configurations": [
        {
            "type": "lldb",
            "request": "launch",
            "name": "skeleton shim",
            "cargo": {
                "args": [
                    "build",
                    "--example",
                    "skeleton"
                ]
            },
            "args": [
                "-namespace",
                "default",
                "-id",
                "1234",
                "-address",
                "/var/run/containerd/containerd.sock",
                "-publish-binary",
                "./bin/containerd",
            ],
            "env": {
                "TTRPC_ADDRESS": "/var/run/containerd/containerd.sock.ttrpc"
            },
        }
    ]
}
As you can see, you can specify the cargo command and then add args and environment variables. Interestingly you need to specify build for the cargo command not run. The extension runs the debugger with the built binary not the cargo run command.
C/C++ for Visual Studio Code on Windows
The C/C++ for Visual Studio Code extension for Windows requires a little more configuration. The first is the debugging configuration:
{
    "version": "0.2.0",
    "configurations": [
        {
            "name": "(Windows) Launch",
            "type": "cppvsdbg",
            "request": "launch",
            "program": "${workspaceRoot}/target/debug/examples/skeleton.exe",
            "args": [
                "-namespace", "default",
                "-id", "1234",
                "-address", "\\\\.\\pipe\\containerd-containerd",
            ],
            "stopAtEntry": false,
            "cwd": "${workspaceRoot}",
            "environment": [
                {
                "name": "TTRPC_ADDRESS",
                "value": "\\\\.\\pipe\\containerd-containerd.ttrpc"
                }
            ],
            "preLaunchTask": "skeleton"
        }
    ]
}
This looks very similar but you can see there isn’t a cargo section. The extension doesn’t know about other tools such as cargo. You might notice instead of a cargo command we specified the path to an actual executable, but how the executable built?
The debugging extension doesn’t build the binary, it just attaches the debugger to the program specified. Building the binary is up to the user. You would need to call cargo build manually every time before running the debugger or you wouldn’t get your new changes. If you are anything like me, this could lead to some very loud debugging sessions.
But the careful observer might also notice that we care calling a preLaunchTask. This preLaunchTask is what calls cargo build for us every time, keeping us cool, calm and collected. Let’s take a look at what is in the preLaunchTask:
{
	"version": "2.0.0",
	"tasks": [
		{
			"type": "cargo",
			"command": "build",
			"args": [
				"--example",
				"skeleton"
			],
			"problemMatcher": [
				"$rustc"
			],
			"group": {
				"kind": "build",
				"isDefault": true
			},
			"label": "skeleton",
		}
	]
}
It’s our cargo build! The label skeleton is the name that we use in the debugger configuration above and let’s use tie the two together. This task can also be easily configured to run automatically or tied to a shortcut as well.
I don’t always use a debugger but when I do it saves a ton of time. It is especially useful for stepping through the complex code of a new project or finding bugs.
Happy debugging!
29 Jan 2023
I’ve been learning how to deal with I/O Completion ports for my latest project and found a few libraries that manage it all for me but I was getting strange behavior, So I ended up having to dig deep enough to understand what was happening. I didn’t find a really clear post so here is my attempt.
When I was reading some of the code I found all had slightly different ways of accomplishing detection of a completed I/O call. The two libraries I was referencing were Rust’s Mio crate and go’s winio.
Understanding that they were accomplishing the same task in different ways was key:
- Winio library is treating the read as a synchronous call. When you call
Read or Write on the file it will issue the read call, then wait till the async operation completes. These means if you wish to use this as an async call you should do it on a Go Routine.
- Mio library creates an event loop and the
read/write processing should be handled once the readiness signal is returned. It also converts Windows IO completion into a readiness signal using an internal buffer.
I/O completion’s one little trick
Those are the two key differences in the way each library approaches doing I/O but I was still confused as to how the program “wakes” back up after the I/O completes.
Let’s take a look at the winio code that returns after the system finished the async call to GetQueuedCompletionStatus. Note that the system call to getQueuedCompletionStatus will suspend the thread that calls it.
// ioOperation represents an outstanding asynchronous Win32 IO.
type ioOperation struct {
	o  syscall.Overlapped
	ch chan ioResult
}

func ioCompletionProcessor(h syscall.Handle) {
	for {
		var bytes uint32
		var key uintptr
		var op *ioOperation
		err := getQueuedCompletionStatus(h, &bytes, &key, &op, syscall.INFINITE)
		if op == nil {
			panic(err)
		}
		op.ch <- ioResult{bytes, err}
	}
}
What is going on here? How does the Operating System call know how to fill in an op *ioOperation and how can we then pass data into the channel?
To figure this out we need to see how I/O is “prepared” and then invoked. To prepare the I/O we create an I/O operation and this is where a channel is created:
func (f *win32File) prepareIO() (*ioOperation, error) {
	f.wgLock.RLock()
	if f.closing.isSet() {
		f.wgLock.RUnlock()
		return nil, ErrFileClosed
	}
	f.wg.Add(1)
	f.wgLock.RUnlock()
	c := &ioOperation{}
	c.ch = make(chan ioResult)
	return c, nil
}
Then we issue the Read passing the reference to the ioOperation and wait for it to complete in ;’asyncIO’. Note that even though this is called asyncIO it is a blocking operation. The thread that gets suspended isn’t this one, it is the one running the go routine with ioCompletionProcessor loop.
	...snip...
	var bytes uint32
	err = syscall.ReadFile(f.handle, b, &bytes, &c.o)
	n, err := f.asyncIO(c, &f.readDeadline, bytes, err)
	runtime.KeepAlive(b)
	...snip...
Inside the `asyncIO we find we are waiting for the channel to be filled:
	...snip...
	var r ioResult
	select {
	case r = <-c.ch:
		err = r.err
		if err == syscall.ERROR_OPERATION_ABORTED { //nolint:errorlint // err is Errno
			if f.closing.isSet() {
				err = ErrFileClosed
			}
		} else if err != nil && f.socket {
			// err is from Win32. Query the overlapped structure to get the winsock error.
			var bytes, flags uint32
			err = wsaGetOverlappedResult(f.handle, &c.o, &bytes, false, &flags)
		}
	case <-timeout:
	    ...snip...
		}
	}
	...snip...
If you read the rest of the code you will not find that channel being used anywhere!
But as you might have guessed by now that channel we saw in the ioCompletionProcessor is the same! How do the two channels get linked together?
The key is a little trick that is used extensively when working with Windows I/O completion ports. When calling getQueuedCompletionStatus we are passing a pointer to the structure Overlapped. The struct we passed look is actually a wrapper:
type ioOperation struct {
	o  syscall.Overlapped
	ch chan ioResult
}
Since we set up the channel during prepareio then passed the pointer to the Read sys call and the OS only fills in the bits for the Overlapped struct when we get the notification that the thread is unsuspended we now have a pointer the the struct that we prepared: ioOperation with a go routine. Then we can pass the value through the channel (which is waiting in the asyncIO function) and the read completes!
This little trick is also used the in the Mio project but slightly differently. Since the Mio project has created an event loop it doesn’t actually wait for the read it just needs to know the event it is associated too (in fact it does copy the buffer internally but that is slightly different than the application doing the reading). The read by the end program will happen at another time. So instead the structure looks a little different but the same trick is used:
#[repr(C)]
pub(crate) struct Overlapped {
    inner: UnsafeCell<OVERLAPPED>,
    pub(crate) callback: fn(&OVERLAPPED_ENTRY, Option<&mut Vec<Event>>),
}
In this case they’ve make it a generic callback function that can be filled with anything.
In other cases you might just have some basic information in and not a call back or channel. It really is up to your use case.
Conclusion
It took me awhile to figure how these calls came together and it was hard to find it explicitly called out anywhere. Hopefully this helps someone who is struggling to figure out the “one small trick” being used here.
I did find eventually find this in a few resources on the topic. I highly recommend reading the following which go over the details of this process in much more detail:
- https://cfsamsonbooks.gitbook.io/epoll-kqueue-iocp-explained/
- https://dschenkelman.github.io/2013/10/29/asynchronous-io-in-c-io-completion-ports/
- https://leanpub.com/windows10systemprogramming (Chapter 11 File and Device I/O)
23 Jan 2023
I have been learning rust lately. I eventually came to some clarity (hopefully) after reading lots of different sources so I’ve compiled there here with some commentary.
Note: I am still learning so please let me know if I’ve got something not quite right. This is my current understanding and your mileage may vary.
Using Traits for dynamic implementations
My first approach to using traits was to use them exactly like I had with interfaces from other languages. This led me to using things like Box and dyn to create trait objects.
We create a trait object by specifying some sort of pointer, such as a & reference or a Box smart pointer, then the dyn keyword, and then specifying the relevant trait. (We’ll talk about the reason trait objects must use a pointer in Chapter 19 in the section “Dynamically Sized Types and the Sized Trait.”) ^[1](https://doc.rust-lang.org/book/ch17-02-trait-objects.html#defining-a-trait-for-common-behavior)
When implementing it I found I was forced to use the Box and pass the types around since their `Size` was unknown:
trait Listener {
    fn Accept(&mut self) -> Result<Box<dyn Connection>>, io::Error>;
}

impl Listener for PipeServer {
    fn Accept(&mut self) -> Result<Box<dyn Connection>>, io::Error>;
}

fn start_handler(conn: Box<dyn Connection>){
  ...snip...
}
This has it’s place in implementations where you don’t know the types ahead of time, such as libraries where you don’t know the types that will be used. There isn’t anything particularly wrong with this but there can be a slight performance hit due to using dynamic dispatch instead of static dispatch:
monomorphization process performed by the compiler when we use trait bounds on generics: the compiler generates non-generic implementations of functions and methods for each concrete type that we use in place of a generic type parameter. The code that results from monomorphization is doing static dispatch, which is when the compiler knows what method you’re calling at compile time. This is opposed to dynamic dispatch, which is when the compiler can’t tell at compile time which method you’re calling. In dynamic dispatch cases, the compiler emits code that at runtime will figure out which method to call. ^[1]https://doc.rust-lang.org/book/ch17-02-trait-objects.html#trait-objects-perform-dynamic-dispatch
Monomorphization approach with Traits
To get around this and avoid the additional runtime overhead, I added an Associated type and then specified the type on the implementation which allows the compiler to need the box. I could also use impl Trait in the parameter position instead of needing the Box<dyn > type:
trait Connection {
    fn close(&mut self) -> io::Result<()>;
}

trait Listener {
    type Type: Connection; // specify trait restriction
    fn Accept(&mut self) -> Result<Self::Type, io::Error>;
}

impl Listener for PipeServer {
    type Type = PipeInstance;  // this is concrete type that implements trait Connection
    fn Accept(&mut self) -> Result<Self::Type, io::Error> {
      ...snip...
    }

fn start_handler(con: impl Connection) {
  ...snip...
}
Note that this is using the impl Trait in the parameter location which is syntactic sugar for Trait Bound Syntax. And so the start_handler could have been writing like:
fn start_handler<T: Connection>(con: T) {
  ...snip...
}
Although they are similar there are two slight differences:
- If you have two (or more) parameters then when using
Trait Bound Syntax the two parameters must be the same. With impl Trait they could be different types
- With
Trait Bound syntax you can use the turbofish syntax (start_handler::<PipeInstance>) and with impl Trait you cannot use that syntax.
Lifetimes with Traits
Now that I removed the overhead of using Trait objects I ran into an issue with Lifetimes I didn’t have when I wasn’t using traits since start_handler actually spins off a thread:
fn start_handler(con: impl Connection) -> thread::JoinHandle<()>
 {
    let newconnection = con;

    let h = thread::spawn(move || {
      ...snip...
    });
    h
  }

  !!! doesn't compile:

  error[E0310]: the parameter type `impl Connection` may not live long enough
  help: consider adding an explicit lifetime bound...
   |
41 | fn start_handler(con: impl Connection + 'static) -> thread::JoinHandle<()>
The above using impl Trait doesn’t compile but interesting if I use the concrete type it does(!?!):
fn start_handler(con: PipeInstance) -> thread::JoinHandle<()>
 {
    let newconnection = con;

    let h = thread::spawn(move || {
      ...snip...
    });
    h
  }
So what is going on here and why is 'static required? Specifically is using 'static bad? As a newbie I really thought it was something to avoid but found a few articles that helped me understand this.
T vs &T
I found two existing questions that were similar to my situation (1, 2) in the Rust help that eventually led to more understanding. It took me some time to parse the answers so let’s break it down:
From the first answer we learn that since the complier doesn’t know what Connection is, it treats it as type T. Type T is encompasses borrowed &T. This means that we could possibly “smuggle a borrowed item to the thread”.
The second answer gives us an example of the difference between T and borrowed &T when running on a thread (try it out on the rust playground)
fn test<T: Send + Sync + std::fmt::Display>(val: T) {
    thread::spawn(move || println!("{}", val));
}

fn evil() {
    let x = 10;
    return test(&x);
}

!!! doesn't compile:

error[E0597]: `x` does not live long enough
17 |     return test(&x);
   |            -----^^-
   |            |    |
   |            |    borrowed value does not live long enough
   |            argument requires that `x` is borrowed for `'static`
18 | }
   |  - `x` dropped here while still borrowed
This makes sense since it would create a dangling pointer to the x when x goes out of scope on function evil. So the Compiler doesn’t allow us to do this.
So if T is encompasses &T that means we could pass in a reference that would go out of scope. So we need the 'static' to ensure that the variable lives at least as long as the program. This makes sense intuitively once you know the rule. On top of that we also understand that if the struct that T represents contains a borrowed pointer this would also be a problem.
But then comes the question, isn’t 'static something that should be avoided?
Using ‘Static
As a beginner, I thought using static would be wrong but lets look into this a bit more. This is pretty common mis-conception as pointed out by the link provided in the second answer:
They get told that “str literal” is hardcoded into the compiled binary and is loaded into read-only memory at run-time so it’s immutable and valid for the entire program and that’s what makes it ‘static. These concepts are further reinforced by the rules surrounding defining static variables using the static keyword
If we continue reading the post a bit more we learn a type can also be bounded by a 'static lifetime which is different from a the case where a variable is compiled into the binary. (I highly recommend reading the post for other insights beyond this).
a type with a ‘static lifetime is different from a type bounded by a ‘static lifetime. The latter can be dynamically allocated at run-time, can be safely and freely mutated, can be dropped, and can live for arbitrary durations.
This means static isn’t all that bad; It is ensuring that we don’t have any borrowed items when we are using the object, because if we did the thread could point at something that goes out of scope (creating a dangling pointer).
Ok so that means we can add 'static and it will compile:
fn start_handler(con: impl Connection + 'static) -> thread::JoinHandle<()>
 {
    let newconnection = con;

    let h = thread::spawn(move || {
      ...snip...
    });
    h
  }
but why doesn’t the example where PipeInstance is passed need the static declaration?
This is because it is an Owned Type and doesn’t contain Borrowed types! This means that the lifetime is in the current Scope. Because it is a concrete type, the compiler can find the type and confirm this that it does not contain any borrowed types. Once it is switched to a impl Trait it can’t be confirmed by the compiler, so I needed to make it explicit.
As an example, If I add a Borrowed type on the struct of the PipeInstance, I would need to annotate the type of Lifetimes. In order to use it in the start_handler function I would then need to ensure that the lifetime of the borrowed item was at least 'static!
This is very nicely described in the Misconception #6.
Another point for 'static lifetimes not being terrible in this scenario is the definition of spawn function itself:
pub fn spawn<F, T>(f: F) -> JoinHandle<T>
where
    F: FnOnce() -> T,
    F: Send + 'static,
    T: Send + 'static,
The ‘static constraint means that the closure and its return value must have a lifetime of the whole program execution. The reason for this is that threads can outlive the lifetime they have been created in.
Indeed if the thread, and by extension its return value, can outlive their caller, we need to make sure that they will be valid afterwards, and since we can’t know when it will return we need to have them valid as long as possible, that is until the end of the program, hence the ‘static lifetime.
So there we have it, 'static lifetimes aren’t something that we need to be afraid of.
Elision Hints
So all this lifetime stuff can be a bit confusing, especially due the fact that many Lifetimes can be Elided so we don’t seem them when we are doing basic work.
One thing I’ve done during this learning period was to turn on rust-analyzer.inlayHints.lifetimeElisionHints.enable in VSCode Extension. At least initially these helps me see the various lifetimes that my program. I might turn it off in the future but for now it helps me understand the implicit lifetimes.
One thing to note, which was initially confusing for me, is that a signature like fn start_handler(con: PipeInstance) -> thread::JoinHandle<()> won’t have a Lifetime! This was initially confusing because I expected to see 'static but now see that it is an Owned type (with no borrowed types in the struct) its life time is the current scope and so the Lifetime annotations aren’t required to track it.
Conclusion
Well hope that helps someone (most likely myself when I forget all this in 6 months). This is my current understand as of the writing of this post, so something might change or be incorrect. Look forward to learning and sharpening this understanding, so leave a comment if something seems off.